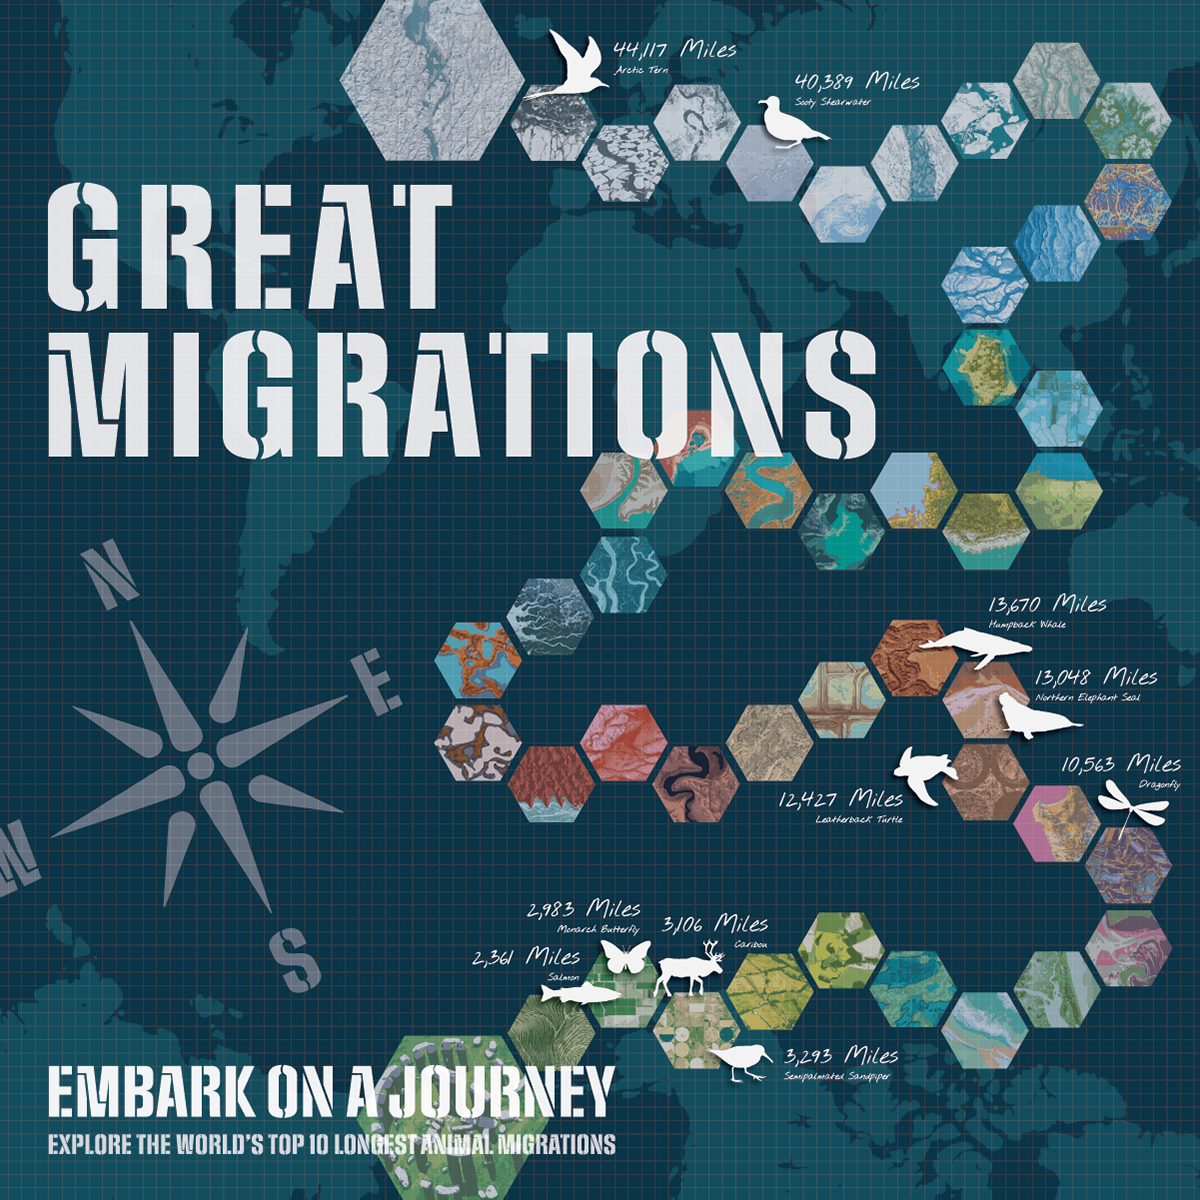
Great Migrations
This piece highlights how information design can be used to tell a compelling story, going beyond the specific topic to emphasize the art of creating visually engaging narratives. Take a look to see the amazing journeys of these animals through the lens of graphic design.
Project Brief:
Develop a visually compelling infographic poster that showcases the art of information design. The goal is to engage viewers with a captivating representation of data, transcending the subject matter, focusing on the creative and effective use of visuals to tell a compelling and memorable story. This project should exemplify the power of graphic design to transform complex information into universally appealing narratives.
My Process:
At the start of this project, I researched a variety of different topics in search of awe inspiring numbers or statistics. I have always been fascinated by the impressive feats of animals, and I ended up stumbling upon the incredible animal migrations I ended up using for this project.
I gathered information and checked my facts. Then I set about doing some math to help me visualize the size and scale of these migrations and put them into perspective. I decided the goal of this graphic would be to display these impressive numbers in a way that helped viewers to grasp the significance of these incredibly distances.
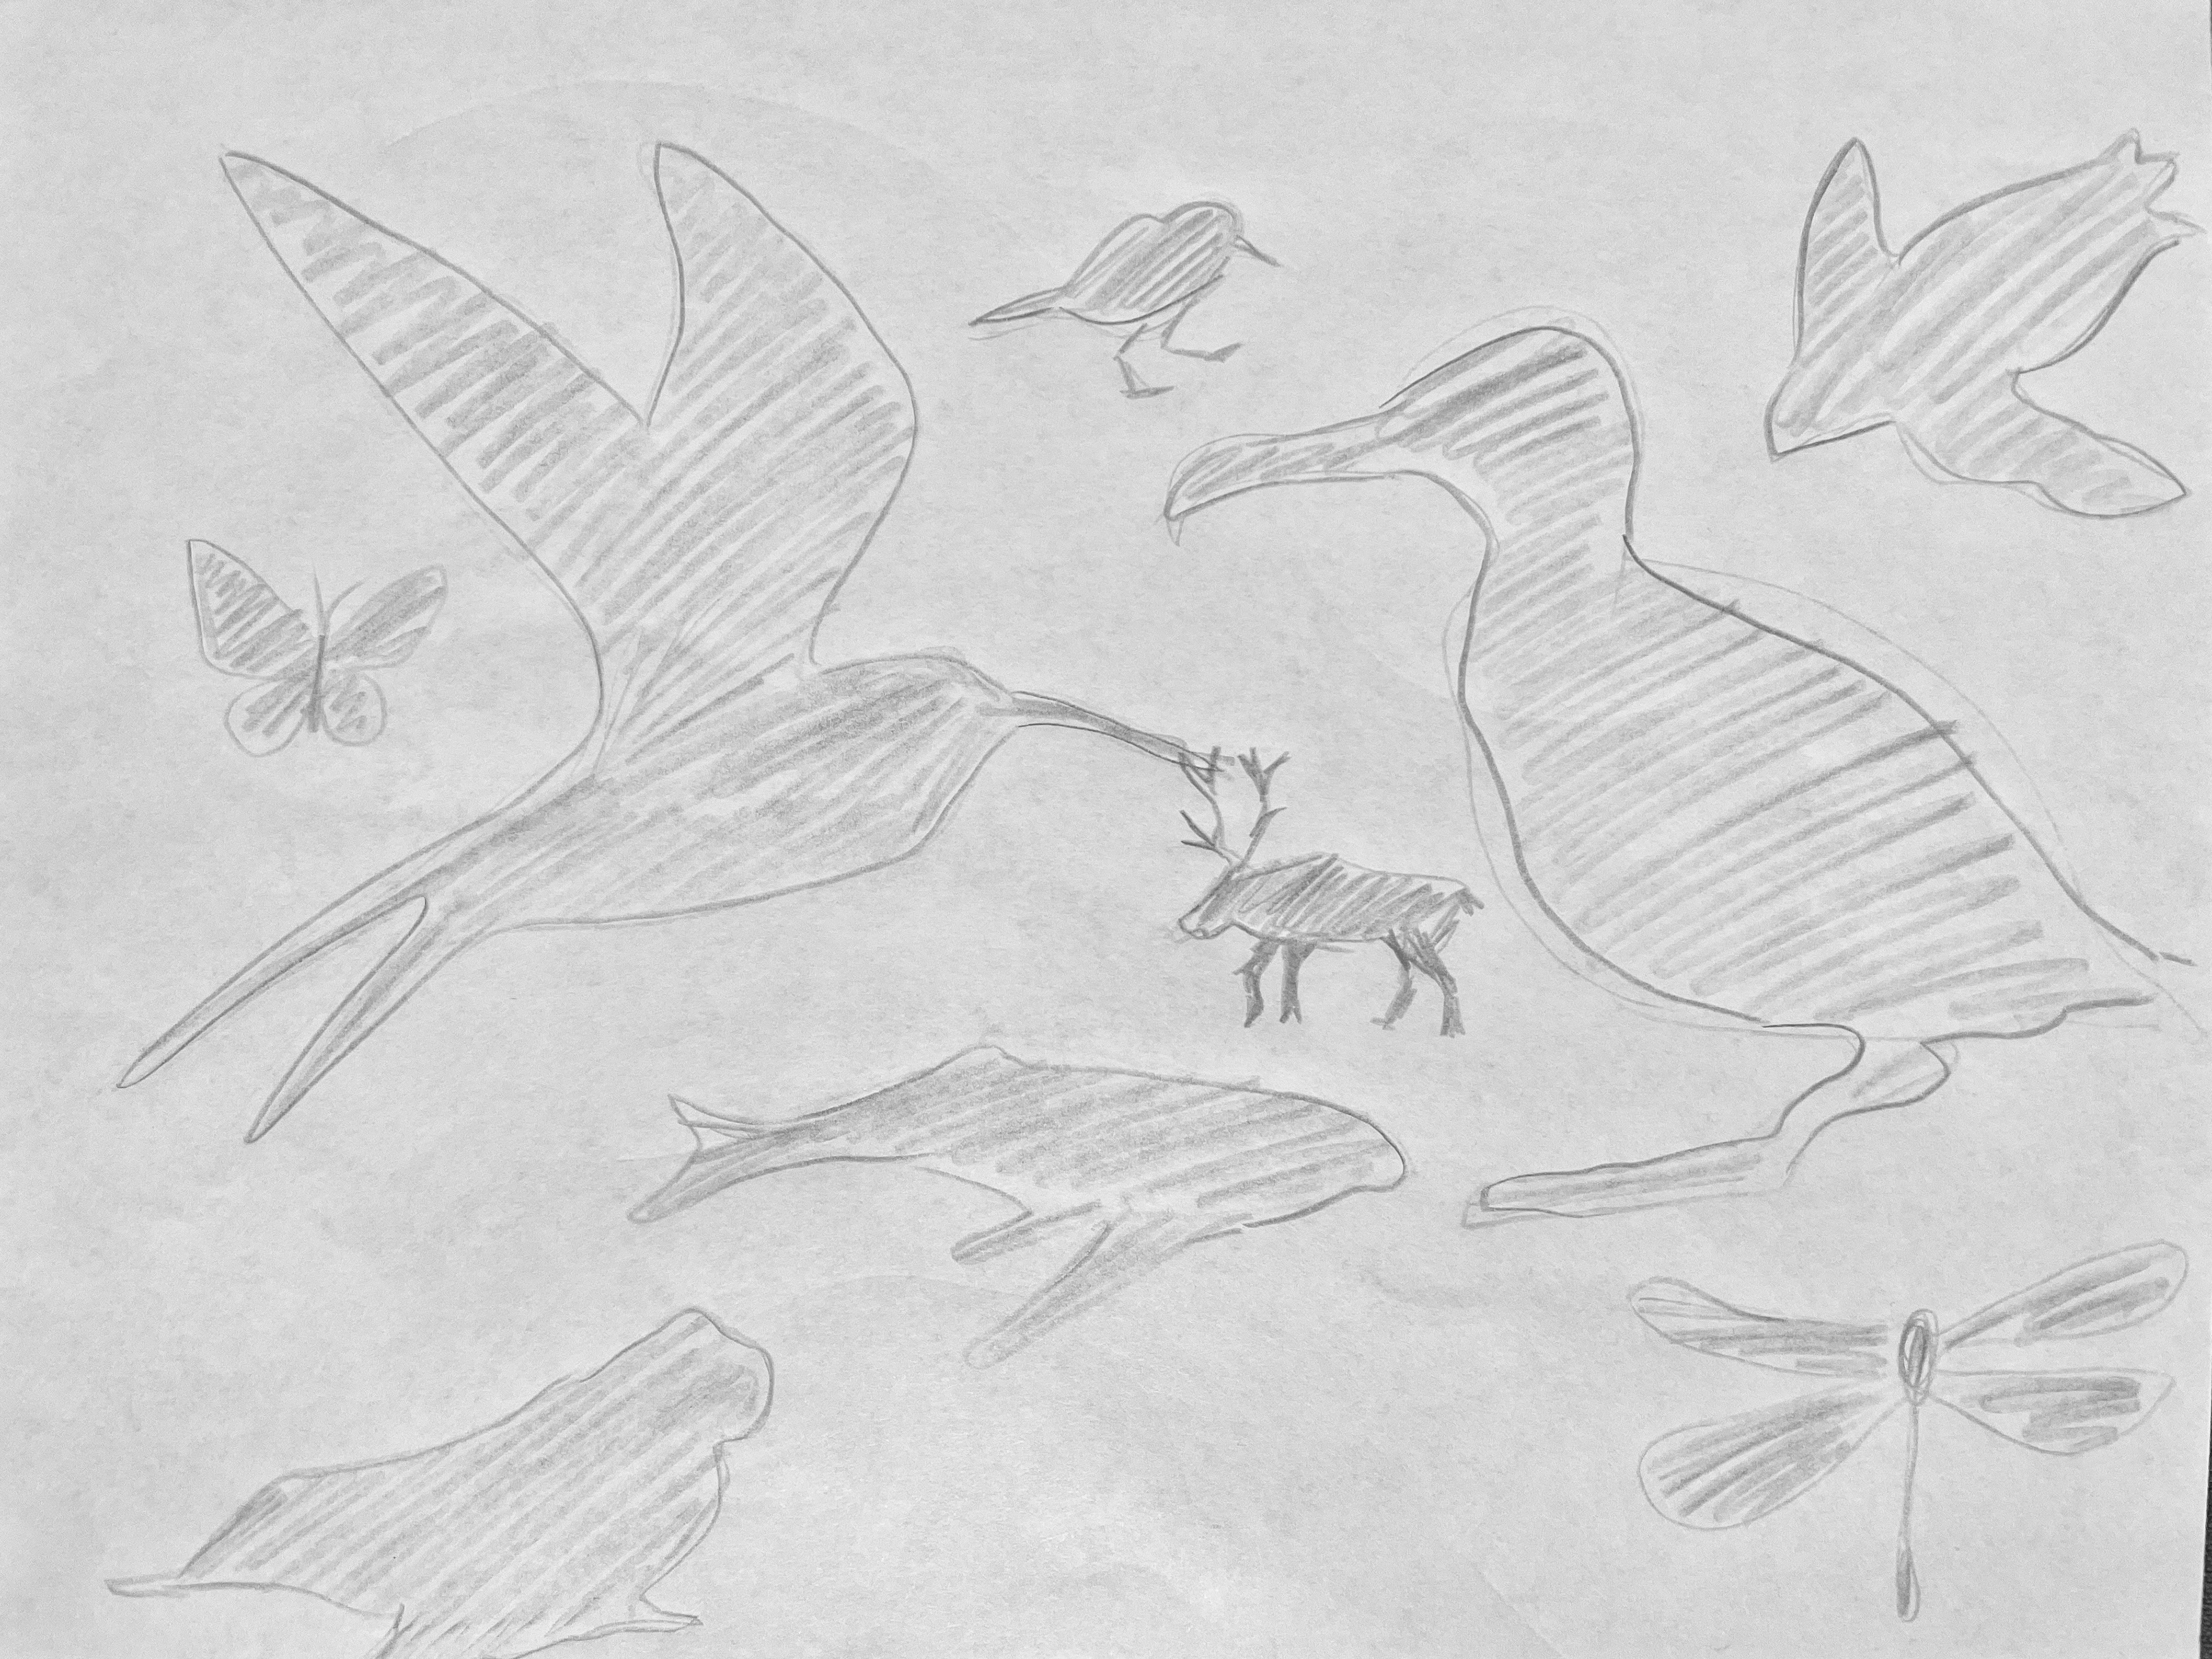
I started by doing some math to make these migration distances into areas of circles that I could compare with one another. I used this same concept to size silhouetted images of the animals to show which migrations were the largest. However, I found that converting distances into areas somewhat dwarfed the initial impression of the longest migrations. This resulted in the distances appearing less impressive, defeating the purpose of the graphic.

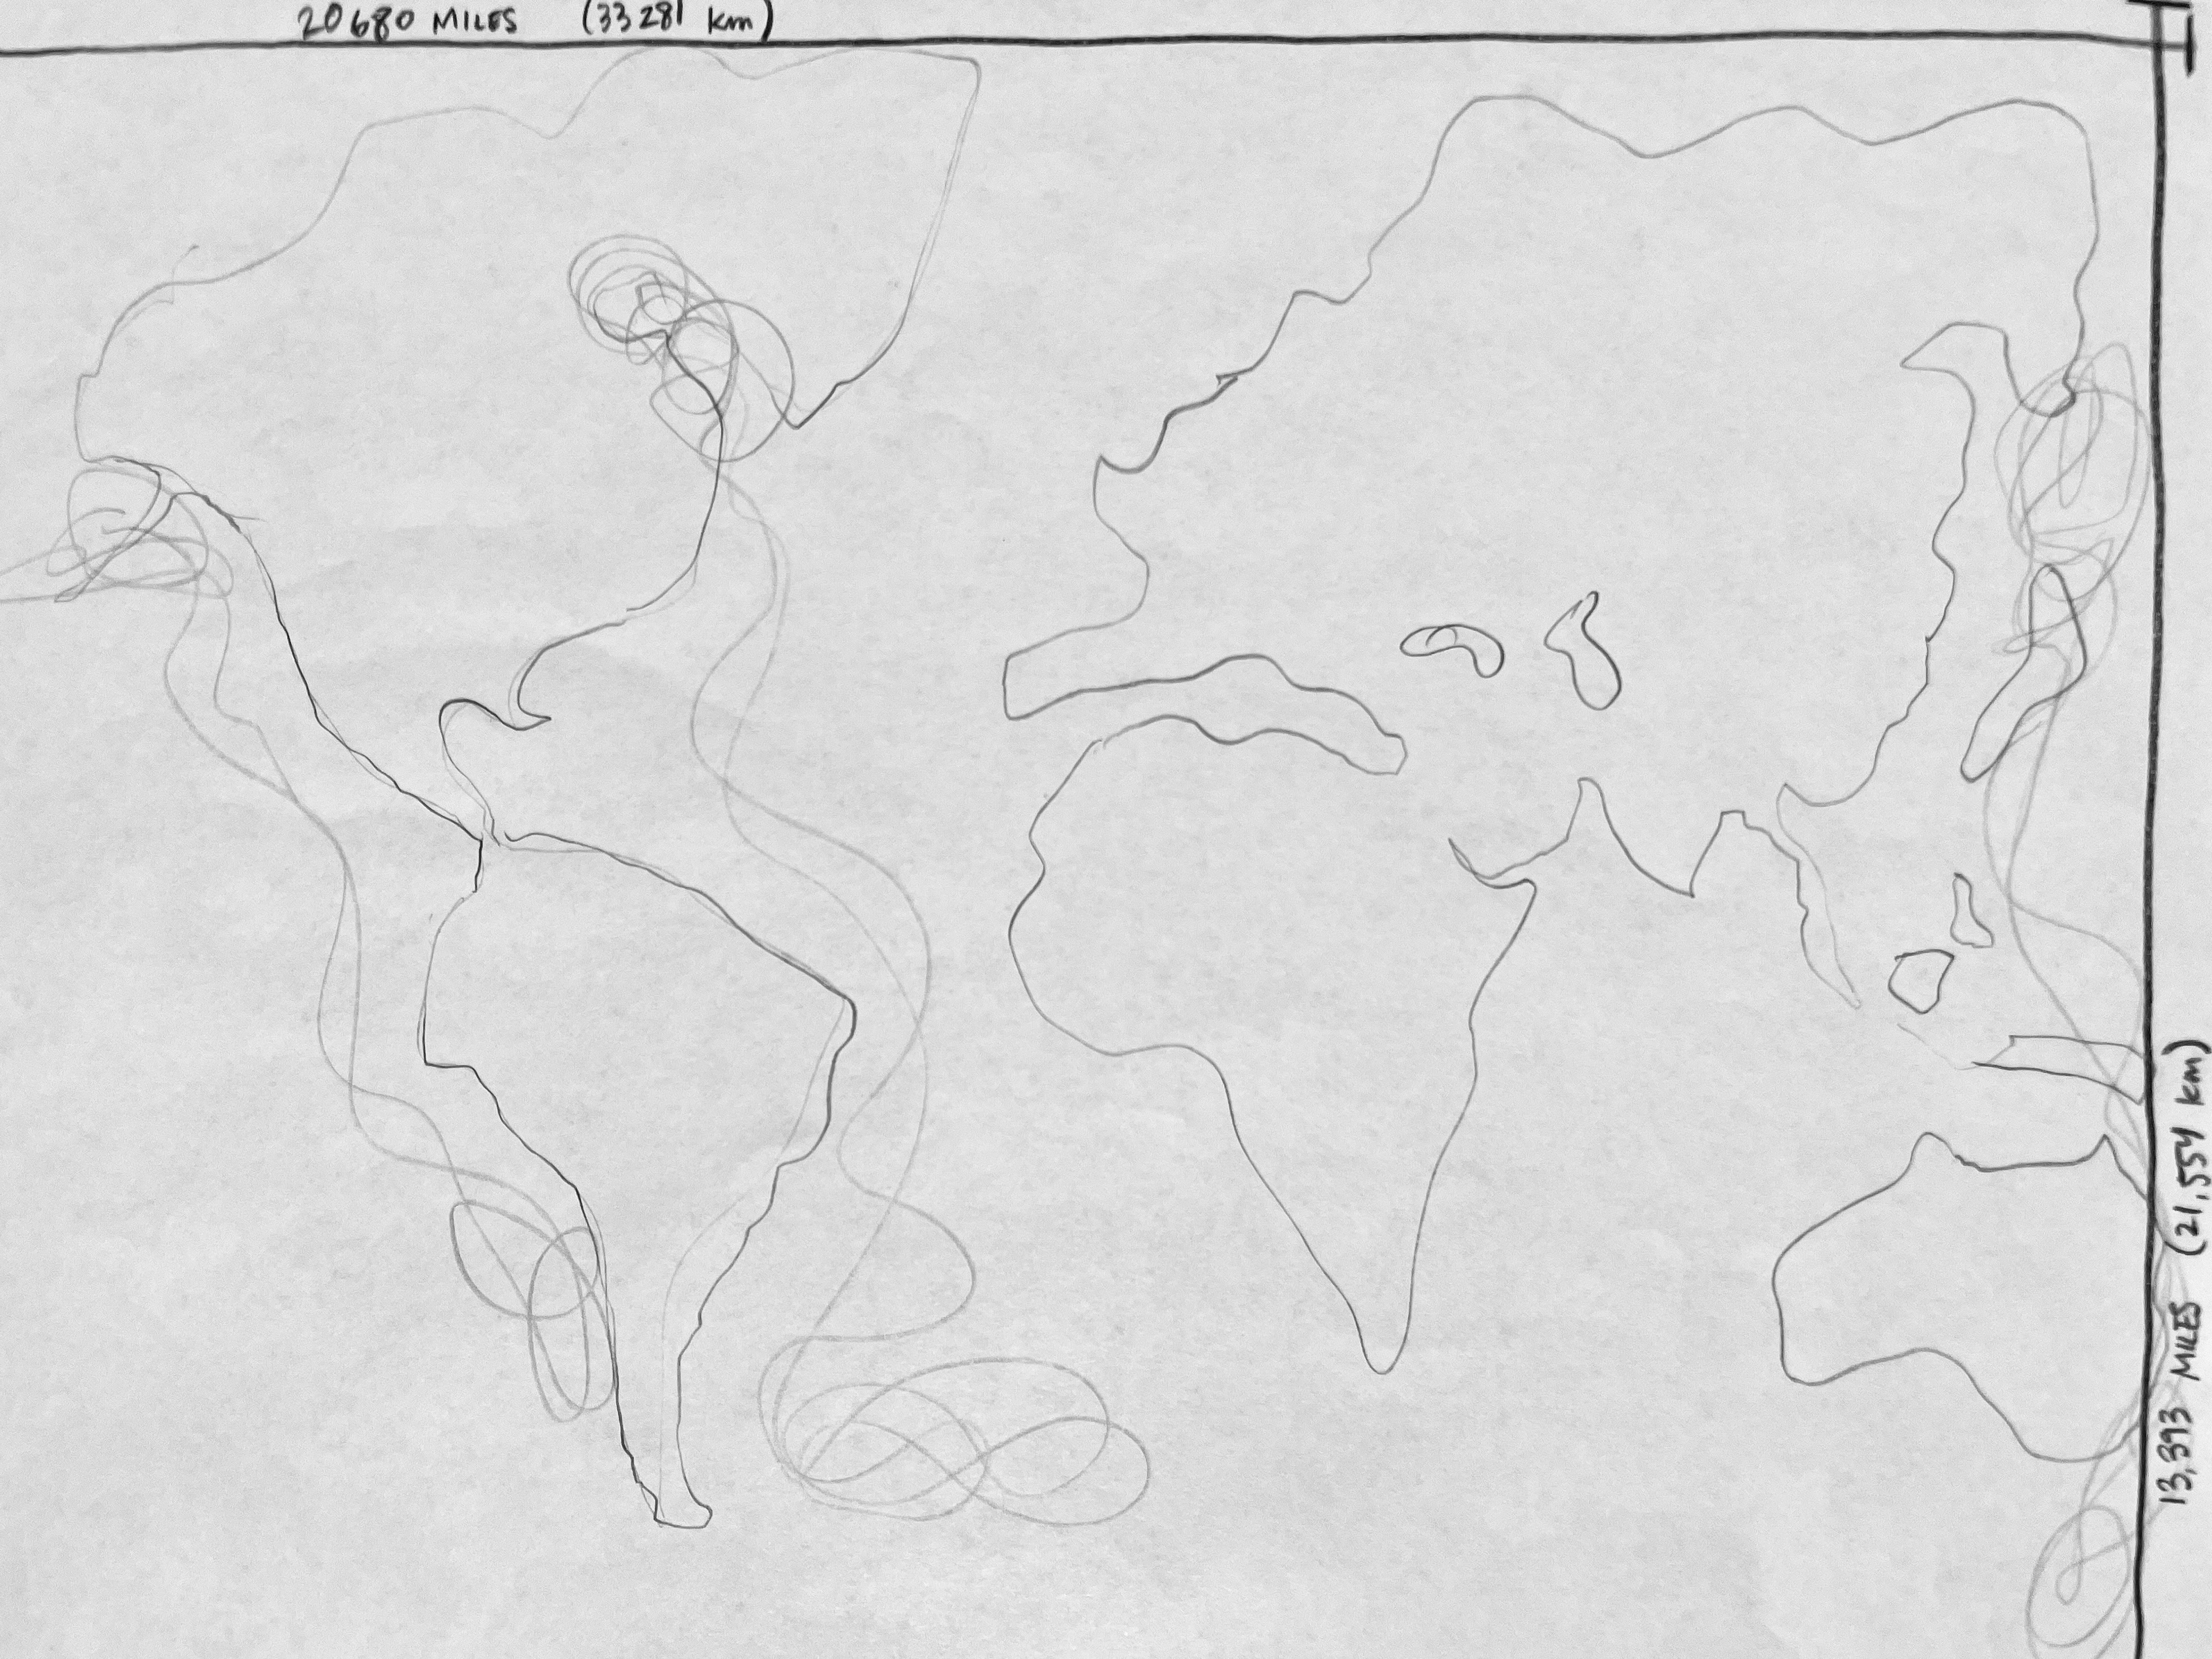
Next I sketched the migration patterns over a world map. I hoped this would put the values into perspective while also providing insight into how these animals covered such unbelievable distances. I found the resulting image did little to compare the migration patterns to one another.
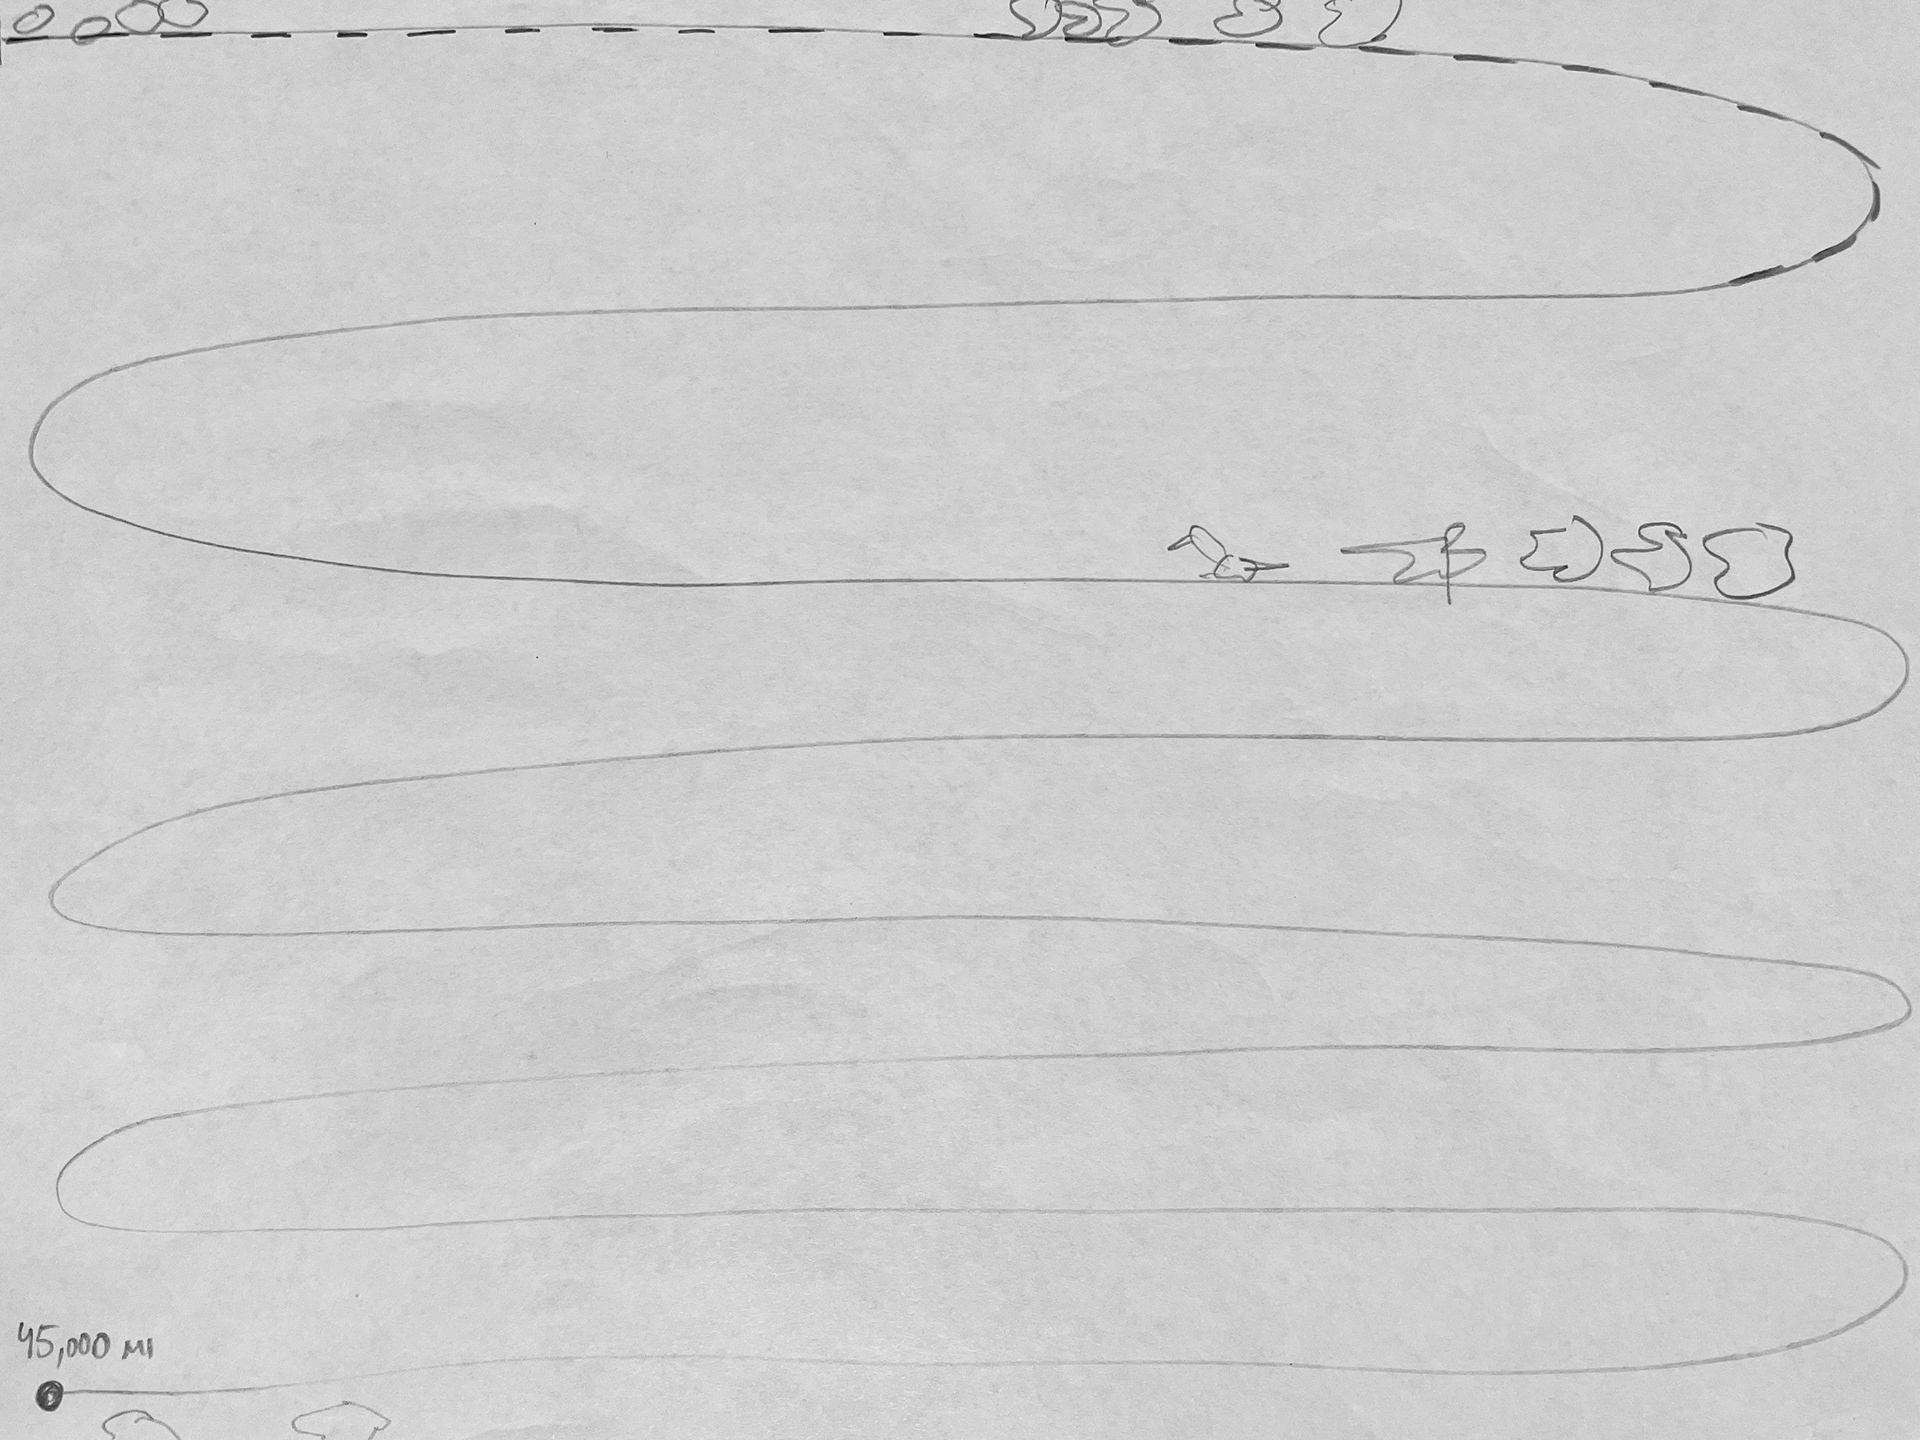
After that I sketched the migration distances on a basic lineup, hoping to see if simplifying the display of the information may allow the numbers to speak for themselves. I found that this was the most effective display so far, but it lacked a compelling theme.
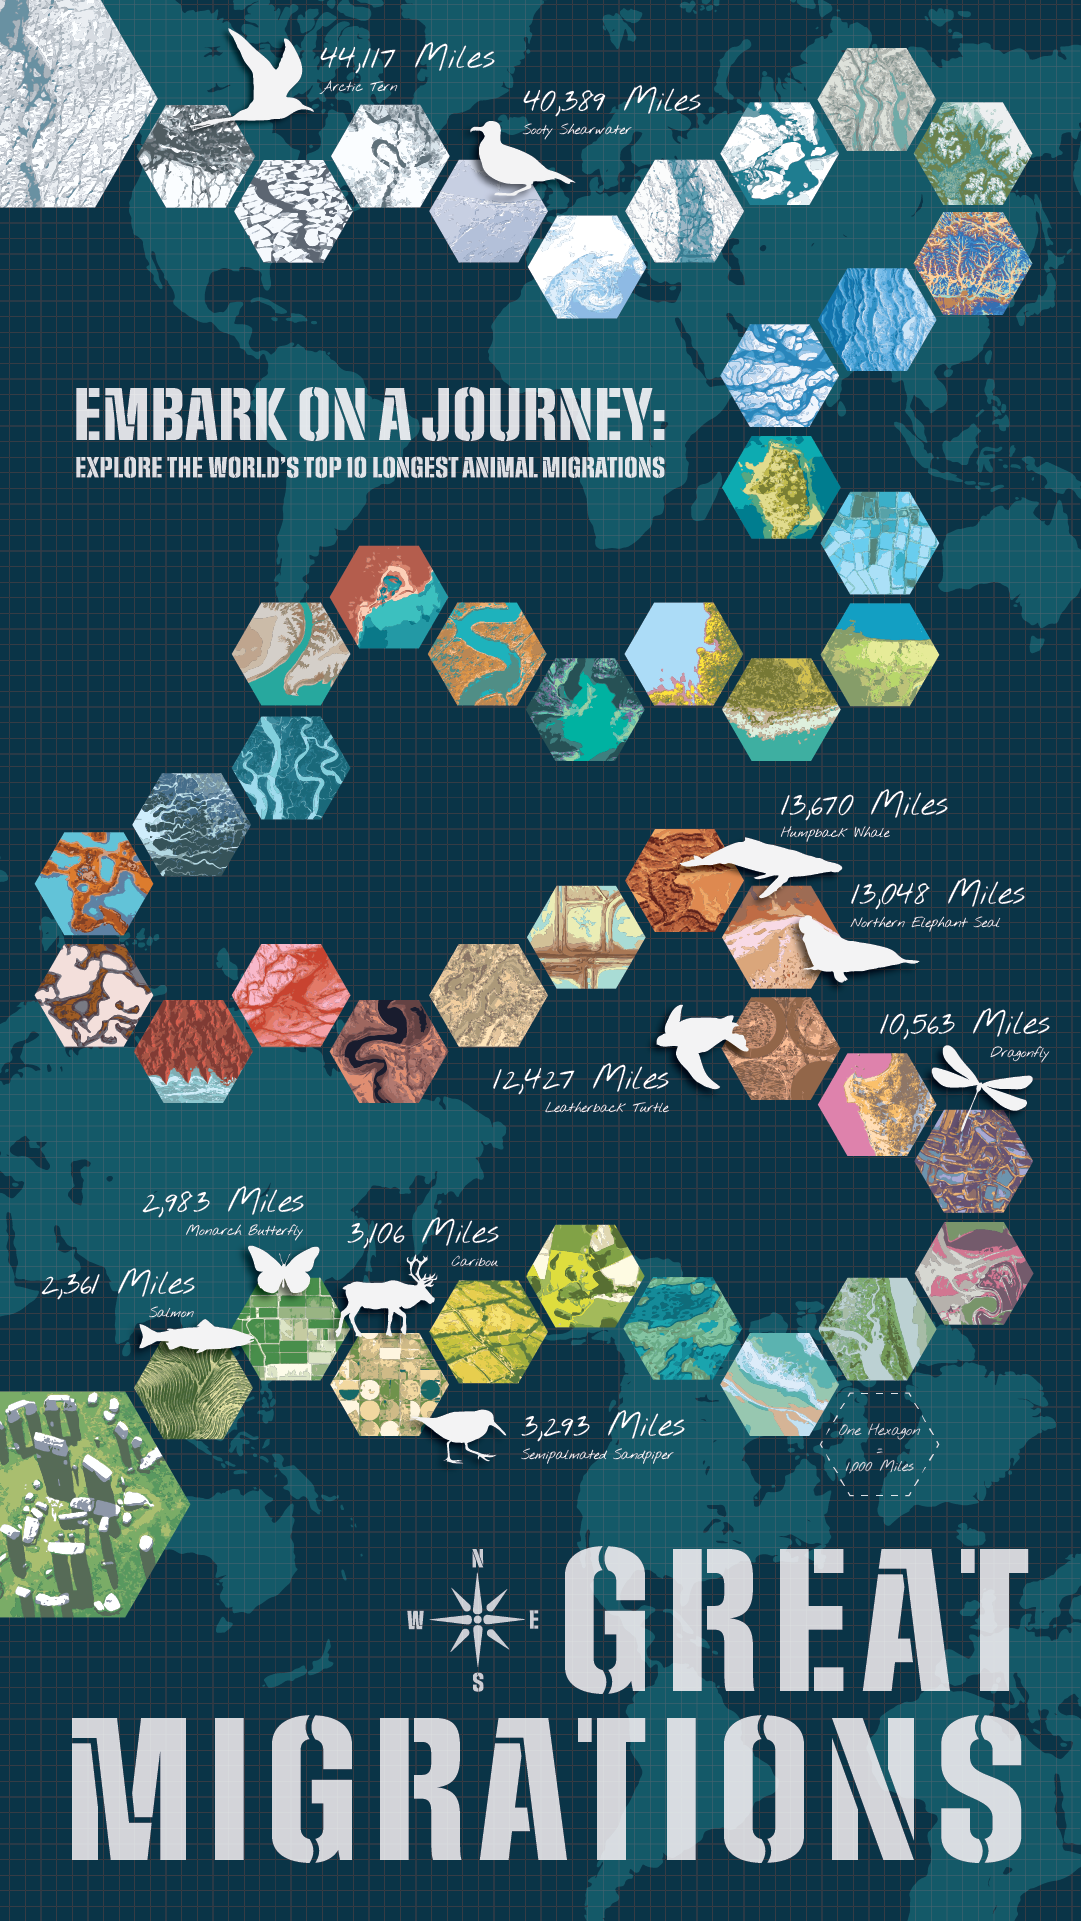
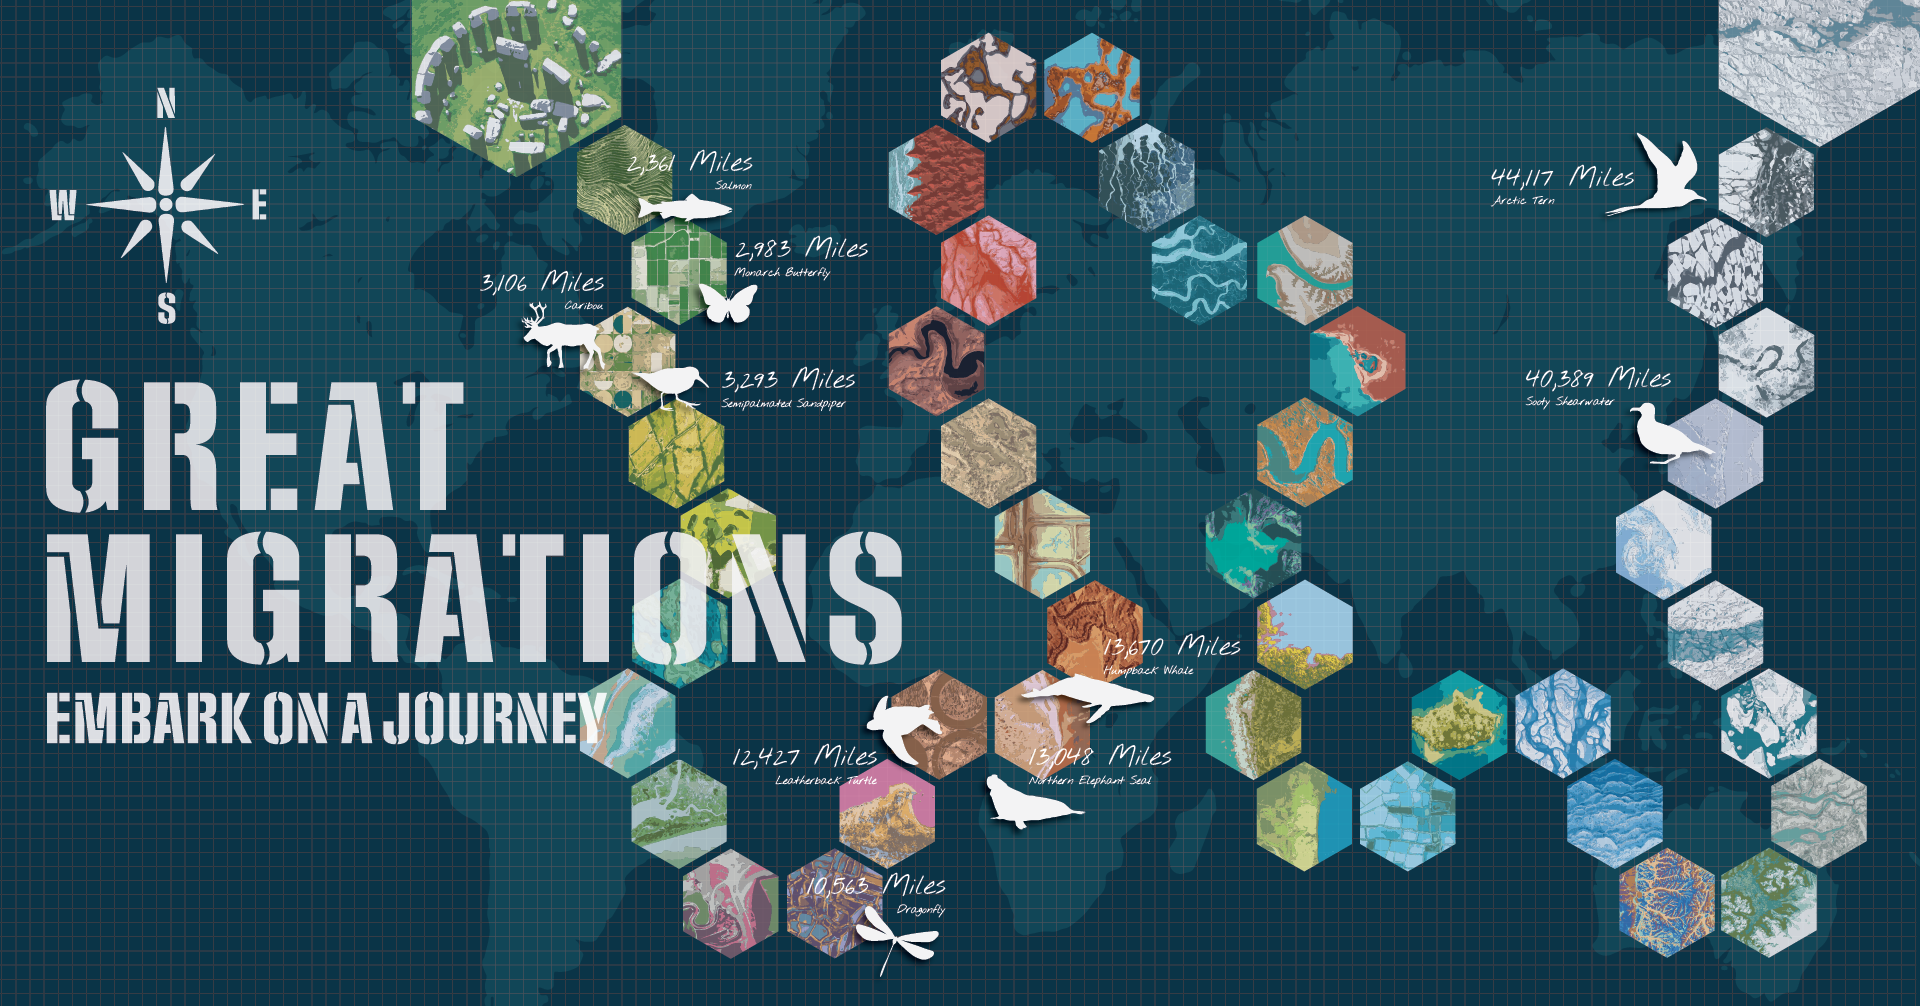
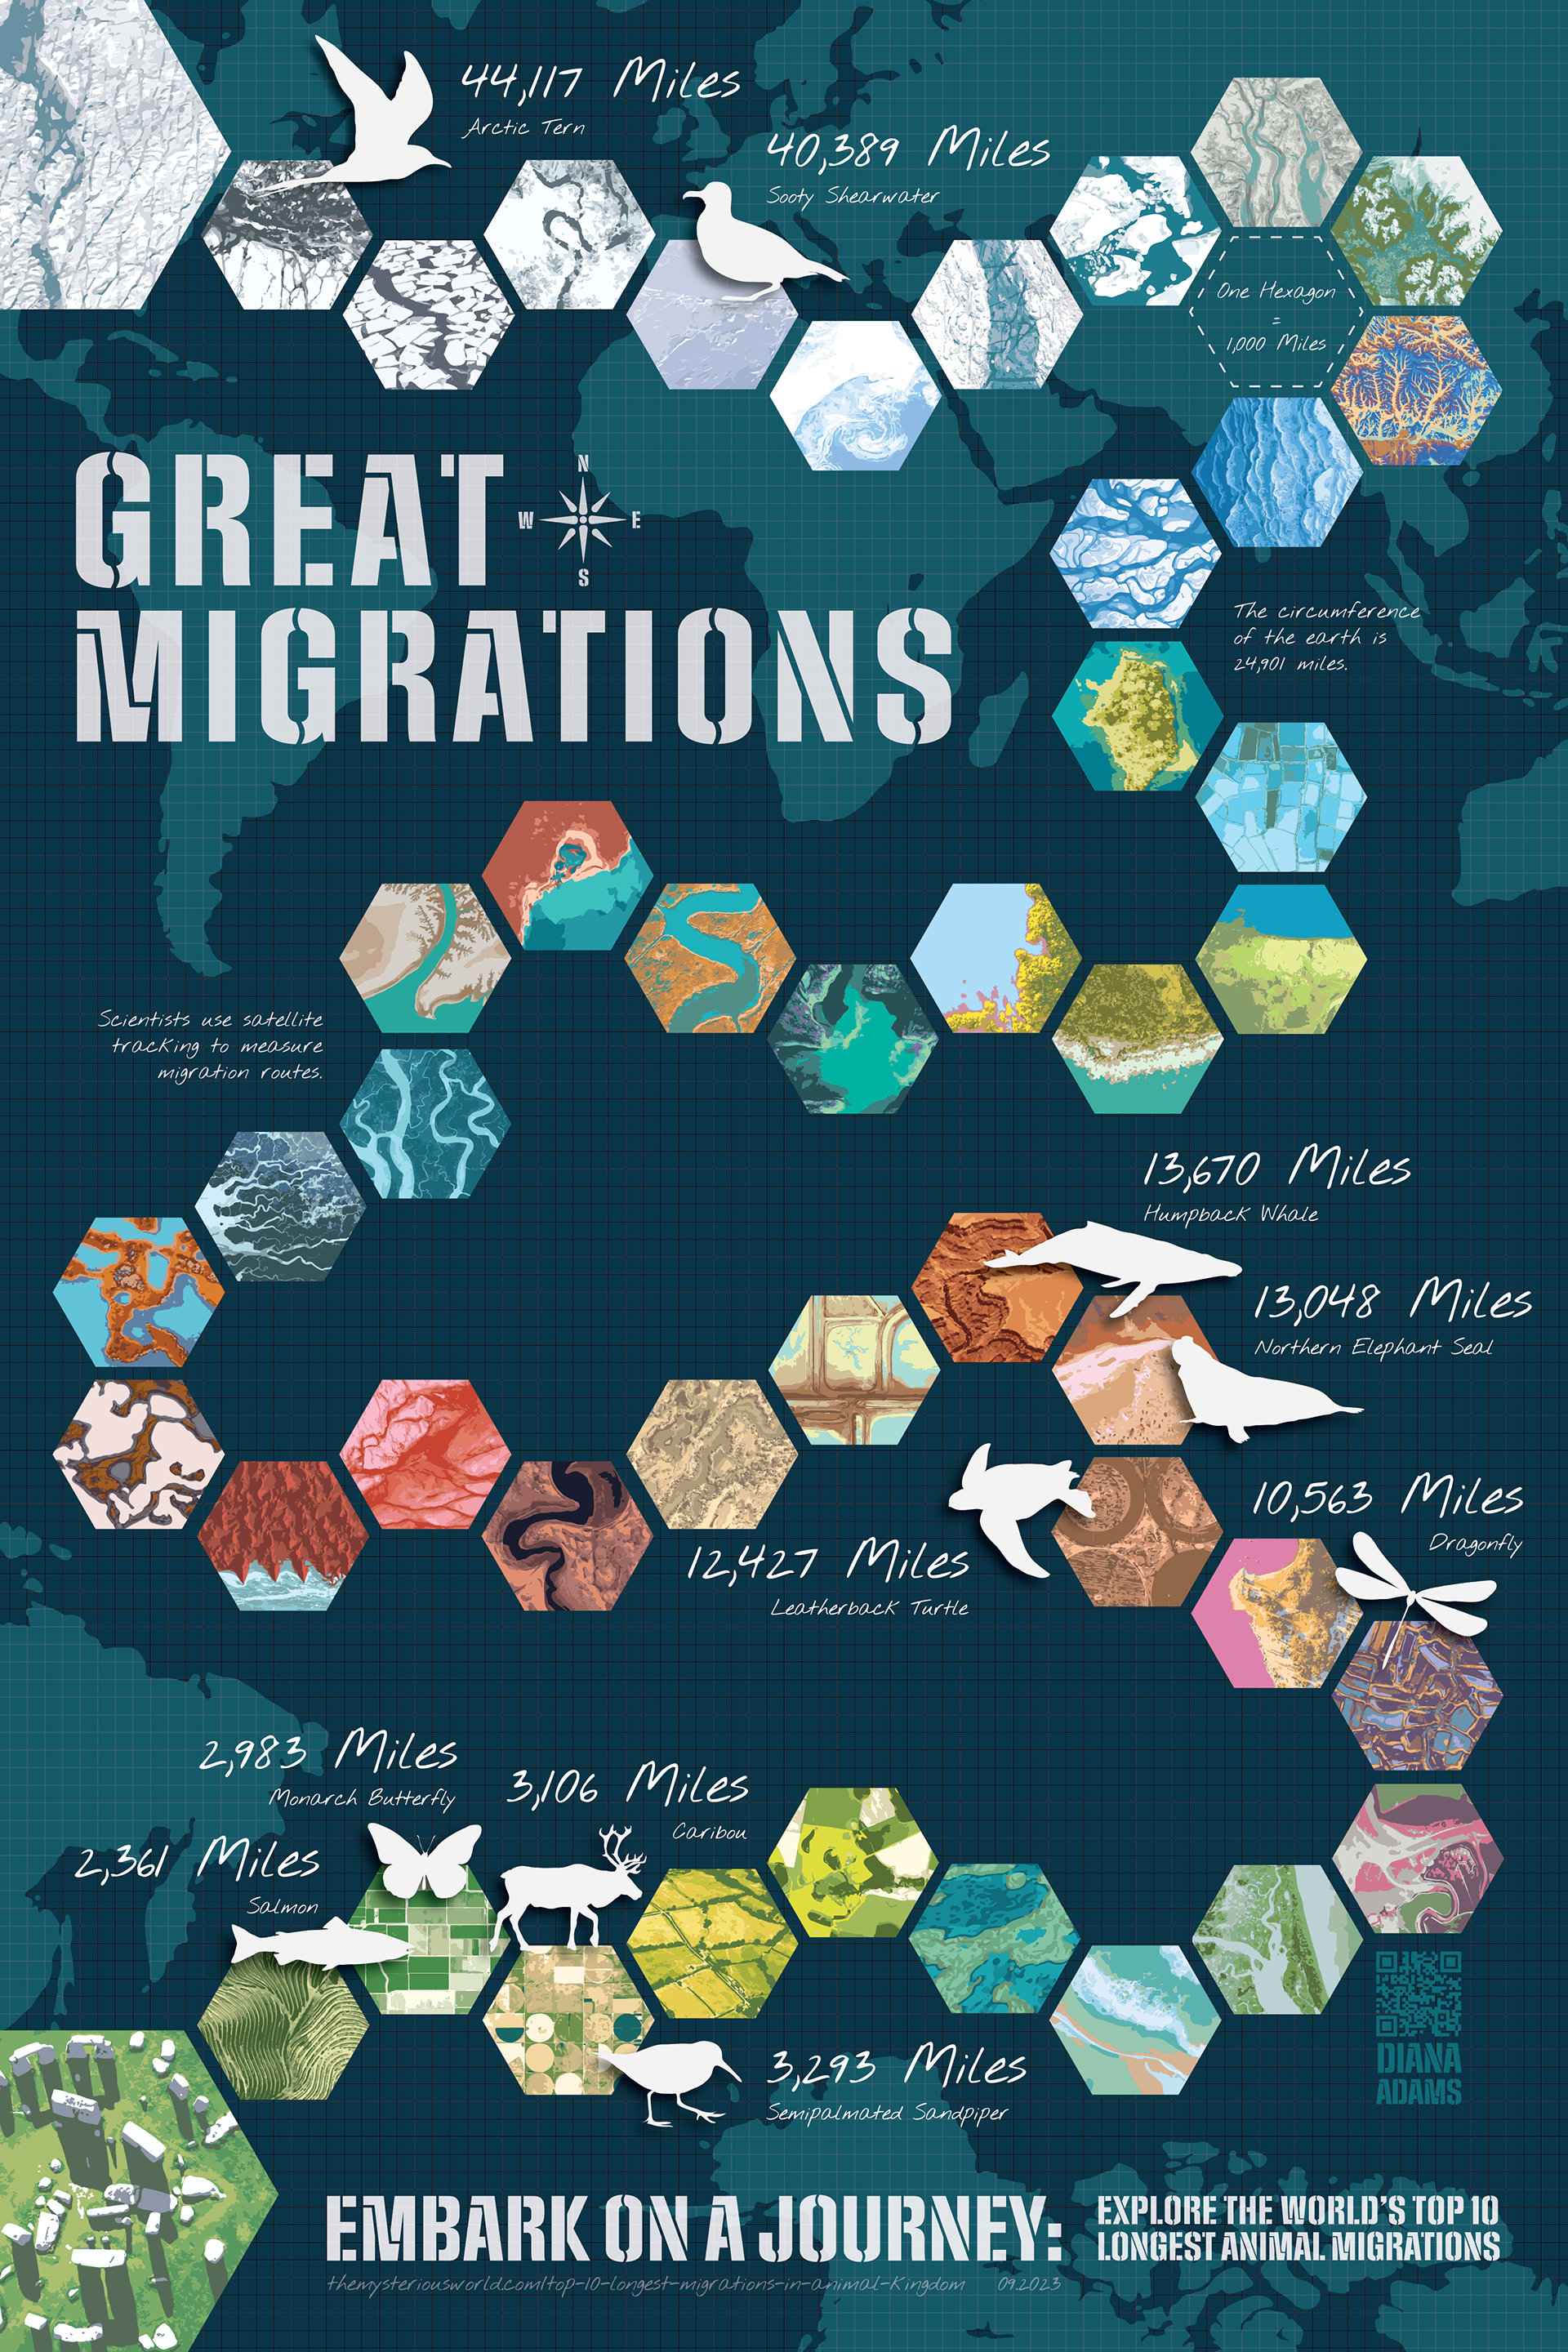
It was at this point that I had the idea to place the information points on some type of game board that would allow me to use other pieces of contextual information to create interest while displaying units of measurement. After some brainstorming, I arrived on hexagon-shaped spaces to allow flexibility of movement, and I settled on the distance each space would represent.
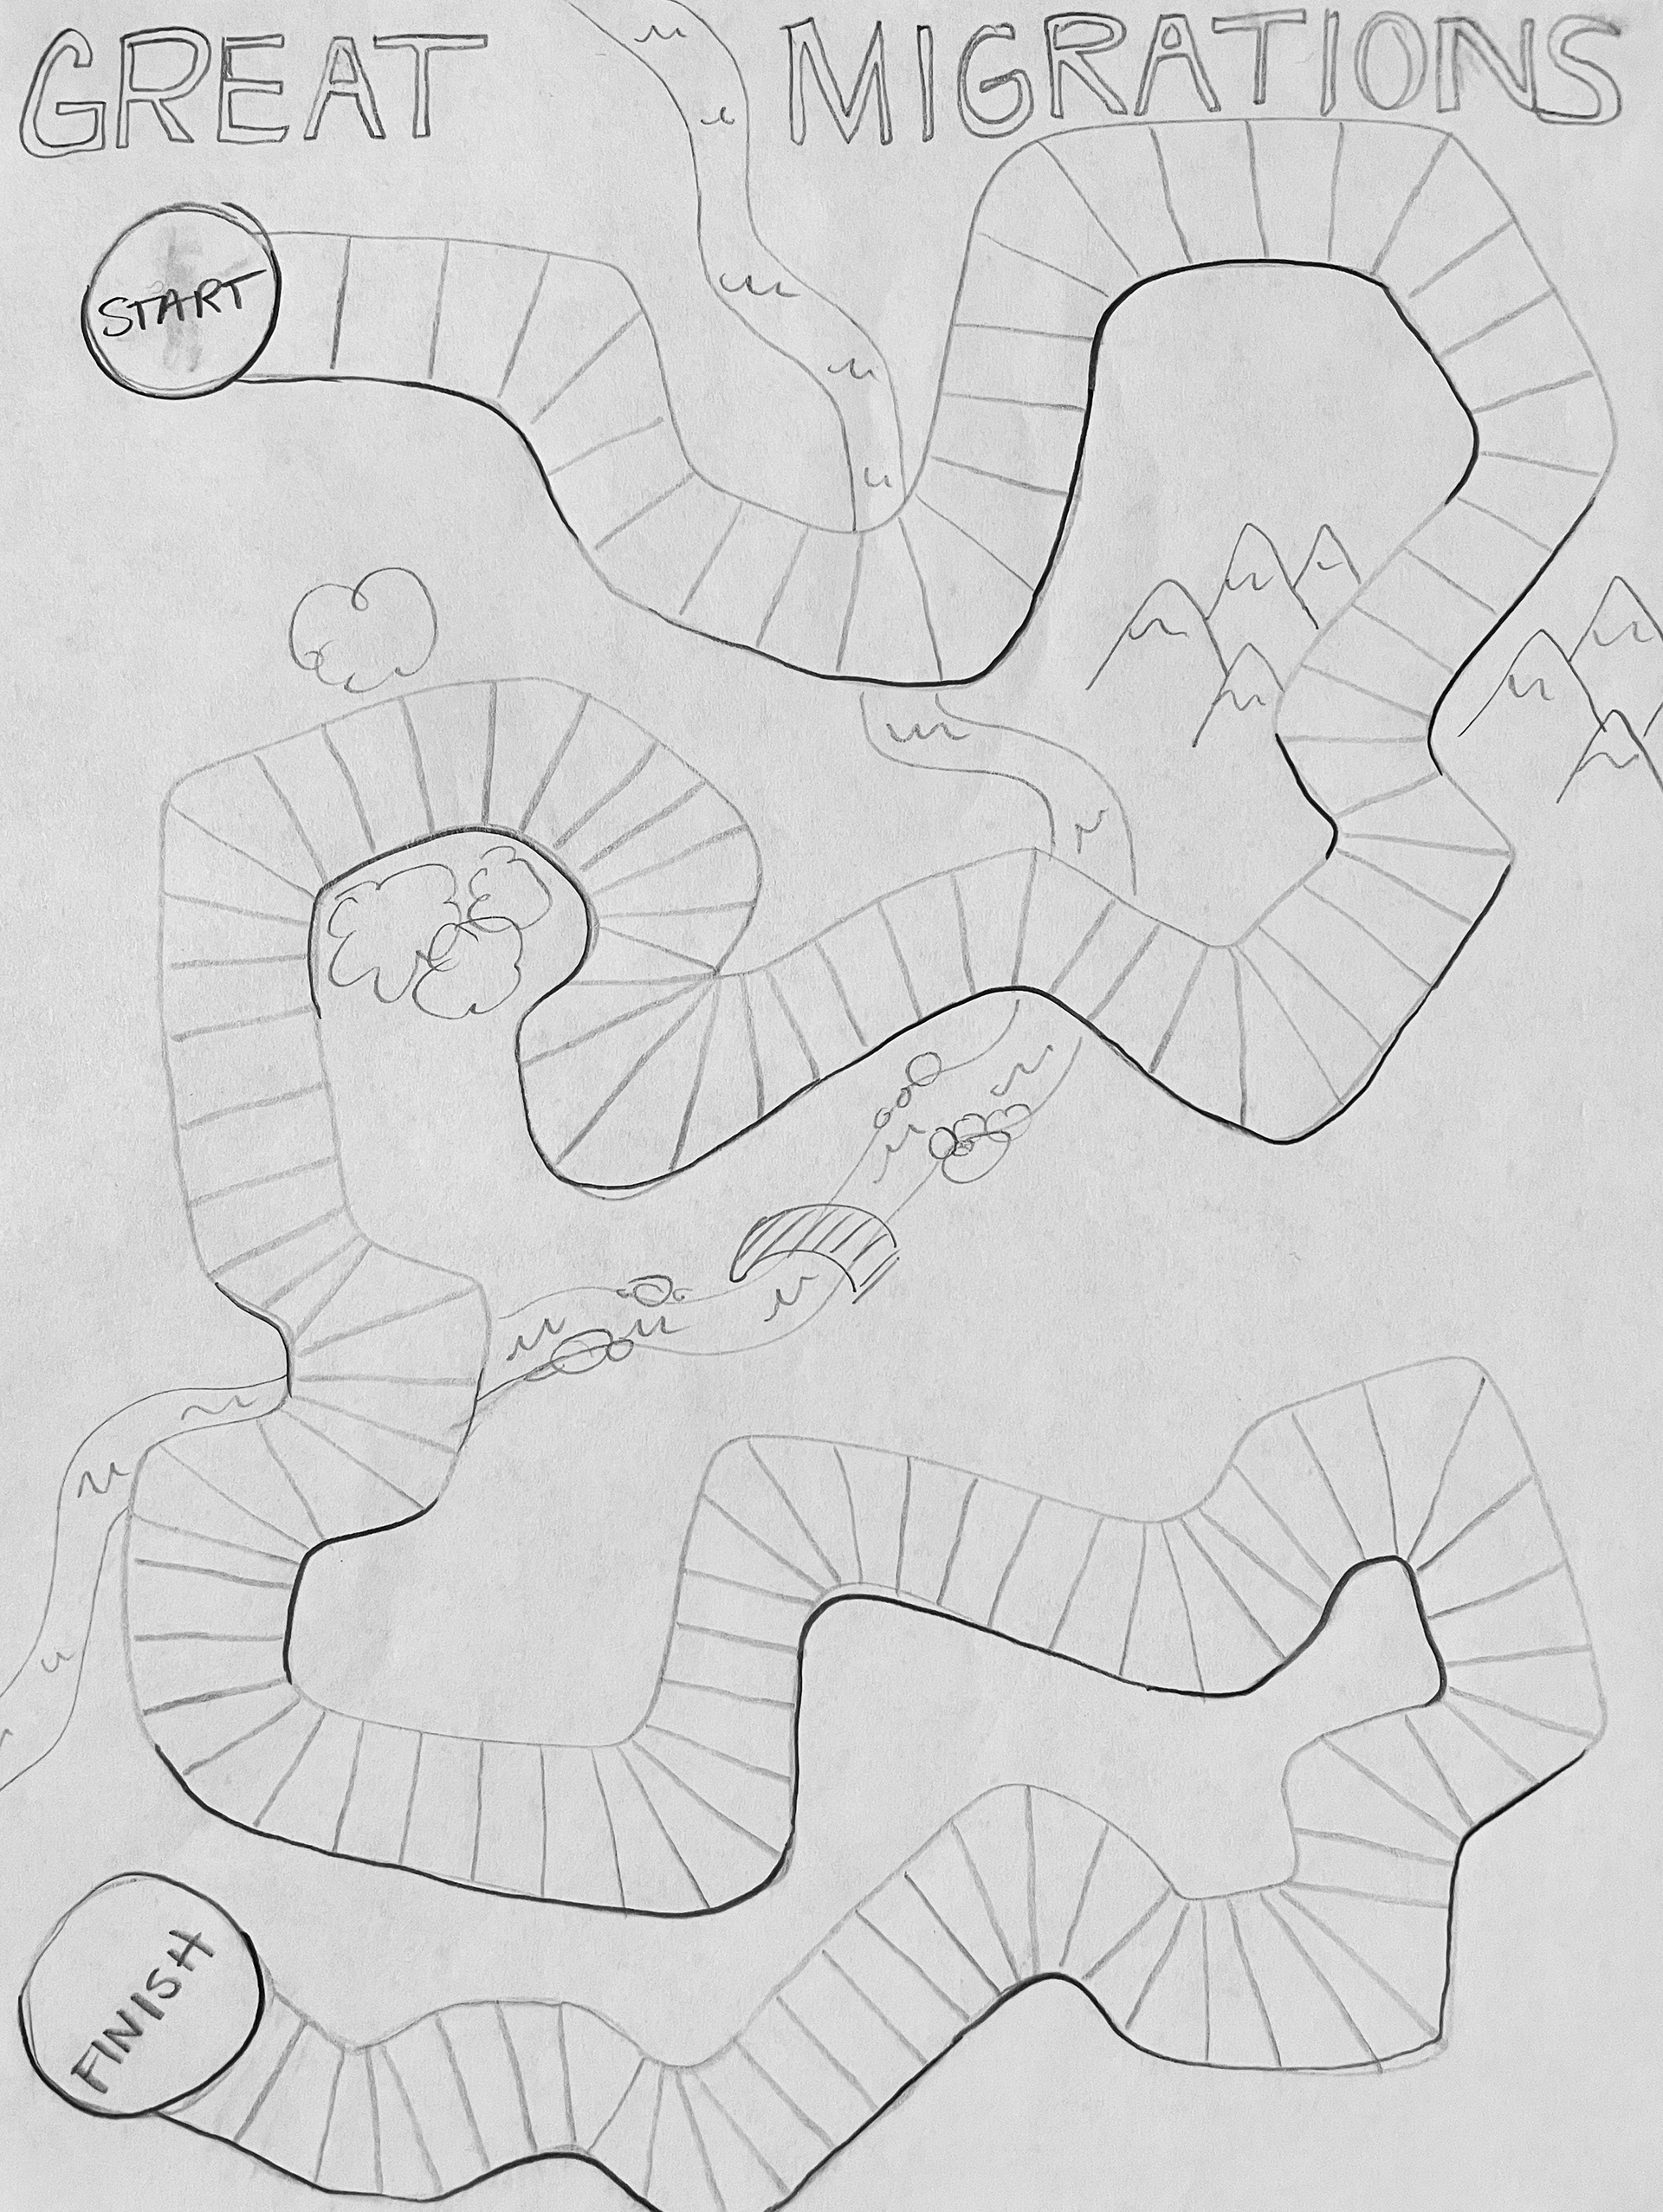
I drew inspiration from some of the most beautiful nature-inspired board games I've played, including Wingspan, Parks, Mariposas, and more. I decided to use colorful aerial imagery and map components to provide the contextual elements for "Great Migrations." I created "player tokens" for each animal and represented them with silhouettes. The result was an enticing, visual display of the most impressive journeys in the animal kingdom.
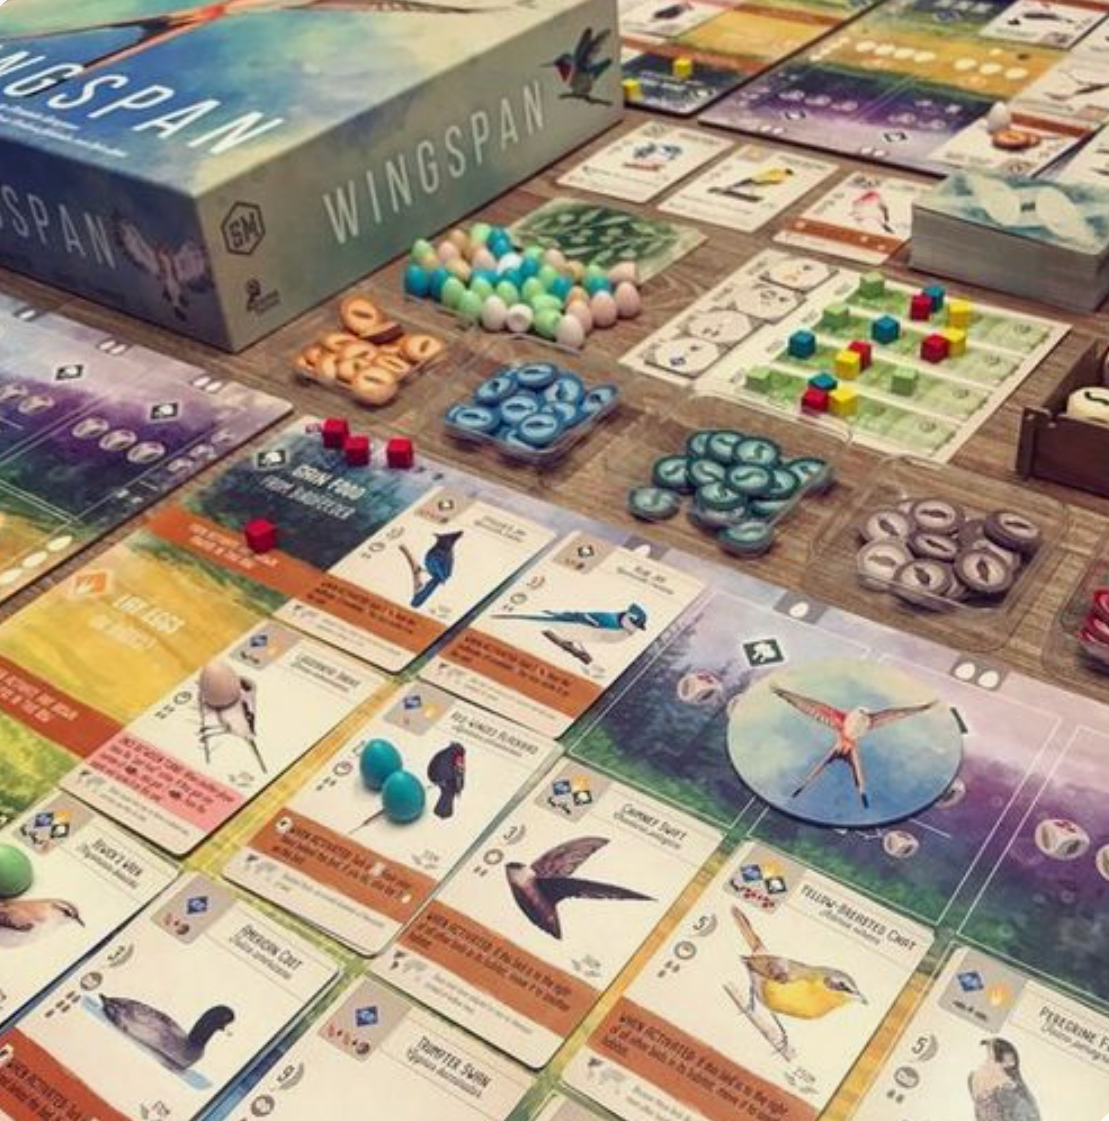
Wingspan
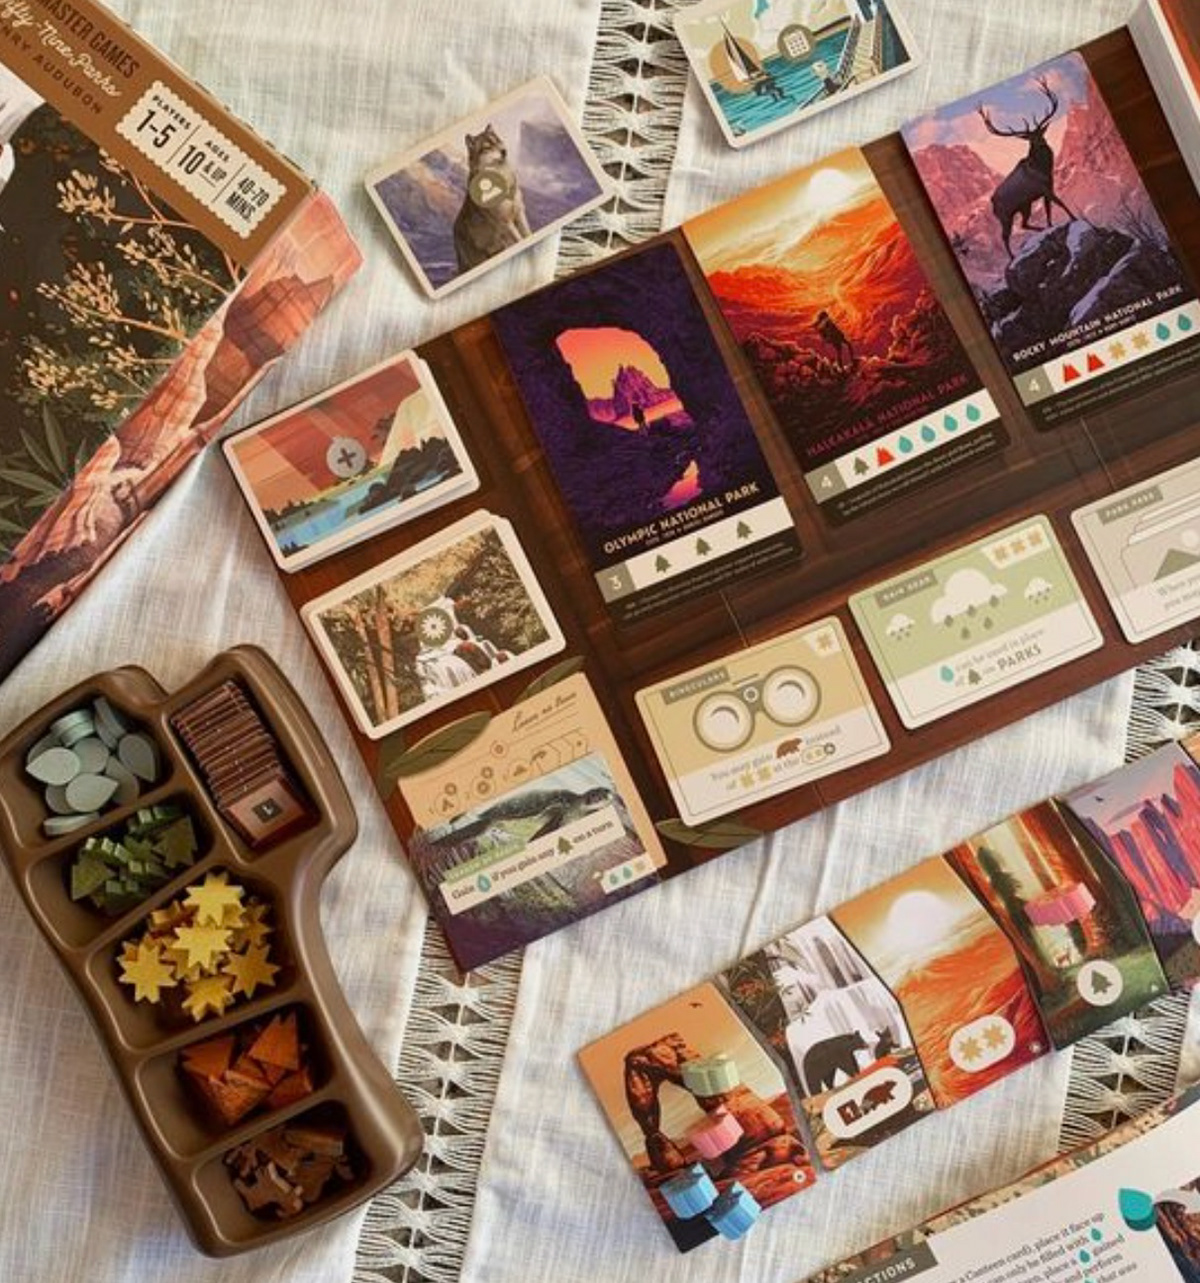
Parks
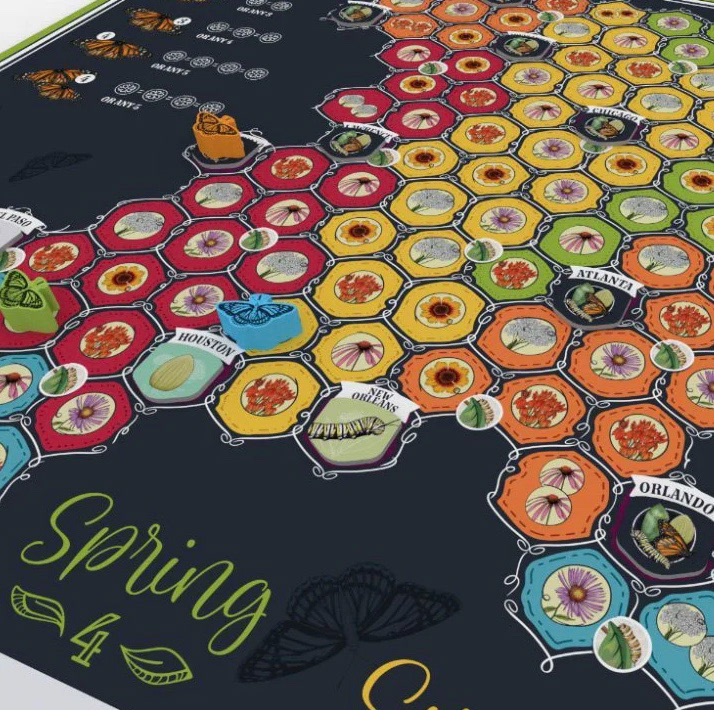
Mariposas
Below are variations on the "Great Migrations" concept for use in a variety of social media applications. See how versatile this piece can be while still conveying the immense journeys of some of the world's most impressive animals.